Create a Test Plan

Create a plan for how you will test/validate each of your make-or-break assumptions.

How to do it

Choose if it will be done through (a) a thought experiment (b) a 2D experiment (c) a 3D experiment or (d) a 4D experiment. Then describe what the test will be.

Download the Test Plan Worksheet

Identify Assumptions

How to do it

Identify all of the assumption you are making in your solution and business model that need to be validated. Identify assumptions around (1) user desirability (2) technological feasibility and (3) business viability.

Then call out which ones are your “make-or-break” assumptions— assumptions which, if not validated, would sink your solution.

Download the Riskiest Assumptions Worksheet

Mapping the Solution

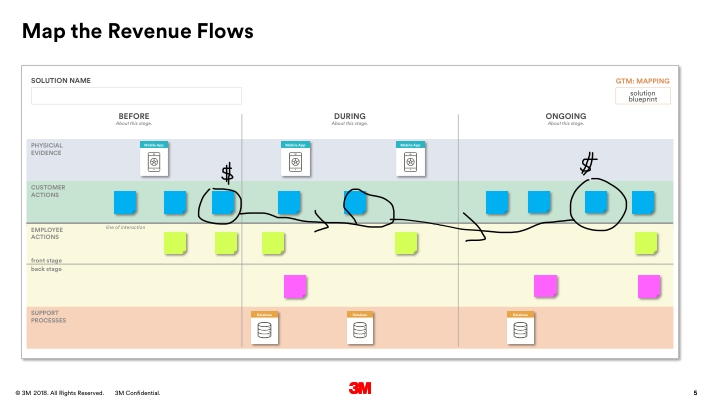
Start by understanding the people, stuff, systems and processes that must be in place in order to deliver your solution.

How to Do It

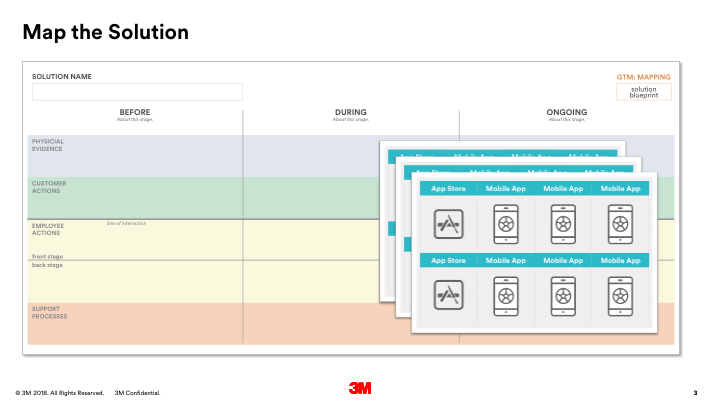
  1. Print and hand or draw the solution blueprint template on the wall. Make you it’s bigger enough to hang post-its and the evidence/support process cards.
  2. Begin by placing the steps in the ideal customer journey(s) in the “customer actions” (green) row. It’s a good idea to write these on post-its so they can be moved around as needed. You may have more than one customer/customer journey.
  3. Next, fill in the employee journey(s) in the “employee actions” (yellow) rows. The top row is for actions where an employee is interacting directly with a customer. The bottom row is for any action that happens in-directly or behind the scenes.
  4. Now, determine and place the “support processes” needed in order for employees to do their job and/or deliver the ideal customer journey in the orange row. Use the provided cards— orange cards— as starters and fill in blank cards as needed.
  5. Finally, determine and place the “physical evidence” of the solution (the physical and digitals manifestations of solution” into the blue row of the blueprint. Use the provided cards— blue cards— as starters and fill in blank cards as needed.
  6. Stand back and review your blue print. Is there anything missing? What needs to be created/acquired first in order to stand up the solution?

Tip: Use post-it notes and re-stickable tape to allow for maximum flexibility and iteration. The blueprint will be iterated upon many times as we build out the rest of the Go-to-Market strategy.

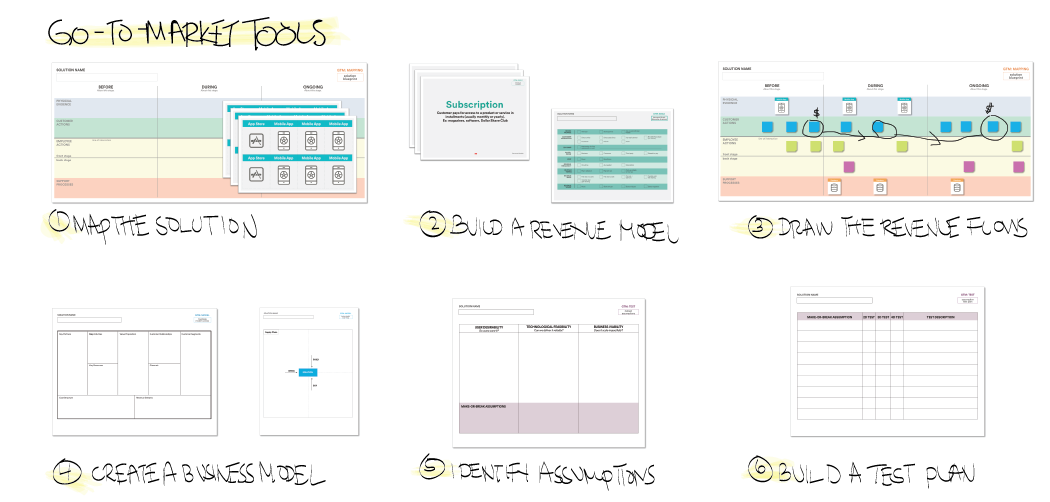
Download the solution blueprint template

Download the physical evidence and support process cards

Go-To-Market Workshop Agenda

The GTM workshop was designed as a half-day hands-on session, although the activities can be broken down into separate sessions.

Before running this session the solution should be clearly defined with (1) a value proposition and (2) and journey map.

Download the editable Word file

Ecosystem Thinking

Introduction to Ecosystem Thinking

Ecosystem Value

  • You can choose to fit in someone else’s ecosystem and provide products that address part of the customer need or you can support your customers by developing an ecosystem of products, services, and data to address the larger opportunity of providing a solution to your customers problem
    • Ecosystem business models have the potential to generate and deliver much grater value

    Why Ecosystem Thinking?

    Services and products don’t exist in isolation so we shouldn’t design them like they do either…


    The 6 Core Interactions & Experiences


    Why Ecosystem Thinking?


    Shaping Disruptive Innovation using Ecosystem Thinking


    3M Design Ecosystem Thinking

    Process & Toolkit


    Understand the Current Ecosystem

    Understand the Current Ecosystem

    Journey Mapping

    Goal

    Understanding of the key moments of a user’s experience

    What it is

    A journey map is a visualization of an experience from the customer’s experience that exposes opportunities for design by illustrating the user’s interactions, pain points, needs, and emotions or attitudes.

  • Create alignment with key stakeholders by collaborating on the journey map
  • Visualize the sequence of important moments and interactions
  • Allows team to edit, elaborate, and validate the journey map through contextual inquiry
Resources

Use this Excel template to map the journey of each user, stakeholder, and influencer.

Evaluate Using
  • Contextual Inquiry
  • Interviews
  • Surveys
  • Task Analysis
  • Diary Studies
Tip

Notice how experiences vary across different users/stakeholders at different points in time.

Journey Mapping


Ecosystem Mapping

Goal

Understand the relationships between people, places, physical touchpoints, and information.

What it is

Ecosystem maps are used to visualize the types of relationships between people, places, devices/products, and information. They help paint the bigger picture, and can be really useful for highlighting innovation opportunities.

  • Paint the bigger picture
  • Visualize the types of relationships within an ecosystem
  • Understand the flow of data and information
Tools

Mapping the ecosystem can be done with pen and paper, or digitally.

Evaluate
  • Observation
  • Interviews
  • Contextual Inquiry
  • Photo Study
Tip

Be sure to leverage ecosystem mapping for creating the ideal/future state for an experience.


Ecosystem Mapping Example


Ecosystem Mapping Template


Define the New Ecosystem

Defining the New Ecosystem

Storyboarding

Goal

Visualize a potential product experience over time, including the users involved at each step, physical & digital touchpoints, and the flow of information, as well as the impact or value created at each step.

What it is

A series of sequential images representing the user experience of a potential solution that transcends multiple touchpoints, users, and interactions, with supporting details describing the interaction and impact created by each piece of the experience.

  • Understand the sequence of a product experience over time and all of the touchpoints, users, and interactions involved
  • Visualize a the end-to-end experience of a product concept
  • Articulate the value created by each feature and touchpoint
Tools

Use the End-to-End User Journey Storyboard Template to visualize your proposed solution.

Evaluate
  • Stakeholder Interviews
  • Contextual Inquiry
  • Focus Groups
Tip

Visuals don’t have to be perfect as long as they highlight the people, physical & digital components, and transfer of both things and information.


Storyboarding Example


Service Blueprinting

Goal

Understand the relationships, components, and interactions between user types across a service offering.

What it is

A service blueprint is used to visualize the physical touch points, user actions, and support systems across the delivery of a service offering.

  • Understand the infrastructure of processes unseen to the end user
  • Identify opportunities for efficiencies “behind the scenes”
  • Look for opportunities to optimize business processes
Tools

Use the Service Blueprint to map front end and back end interactions.

Evaluate
  • Observation
  • Stakeholder Interviews
  • Contextual Inquiry
Tip

Notice the effect of internal processes on end user experience


Service Blueprinting Example

Design Research: Evaluate & Understand

Design Thinking Framework


Research Planning Tips

Understanding research objectives is critical to successful research.


Design Research Methods

Research is an on-going activity used throughout the iterative design process.


Tools for Building Empathy


Interview Debrief


Analysis & Synthesis